| gtk-hst reference manual | ||||
|---|---|---|---|---|
#include <gtk-hst/gtkhistogram.h>


enum                GtkHstColors;
#define             GTK_TYPE_HST_COLORS
enum                GtkHstAxisPos;
#define             GTK_TYPE_HST_AXIS_POS
enum                GtkHstAttr;
#define             GTK_TYPE_HST_ATTR
enum                GtkHstAxisType;
#define             GTK_TYPE_HST_AXIS_TYPE
                    Canvas;
                    GtkHst1DEvent;
                    GtkHst1D;
                    GtkHst1DClass;
GtkWidget*          gtk_hst1d_new                       (HstFunction *ff);
void                gtk_hst1d_add_curve                 (GtkHst1D *h,
                                                         HstFunction *f);
void                gtk_hst1d_remove_curves             (GtkHst1D *h);
void                gtk_hst1d_monitor_start             (GtkHst1D *h,
                                                         int tim);
void                gtk_hst1d_monitor_stop              (GtkHst1D *h);
void                gtk_hst1d_draw_x_axis               (GtkHst1D *h,
                                                         GtkHstAxisPos val);
void                gtk_hst1d_draw_y_axis               (GtkHst1D *h,
                                                         GtkHstAxisPos val);
gchar*              gtk_hst1d_get_xtitle                (GtkHst1D *hst);
void                gtk_hst1d_set_xtitle                (GtkHst1D *hst,
                                                         const char *tit);
gchar*              gtk_hst1d_get_ytitle                (GtkHst1D *hst);
void                gtk_hst1d_set_ytitle                (GtkHst1D *hst,
                                                         const char *tit);
void                gtk_hst1d_filled                    (GtkHst1D *h,
                                                         gboolean z);
gboolean            gtk_hst1d_is_filled                 (GtkHst1D *h);
void                gtk_hst1d_logx                      (GtkHst1D *h,
                                                         gboolean z);
gboolean            gtk_hst1d_is_logx                   (GtkHst1D *h);
void                gtk_hst1d_logy                      (GtkHst1D *h,
                                                         gboolean z);
gboolean            gtk_hst1d_is_logy                   (GtkHst1D *h);
void                gtk_hst1d_show_stats                (GtkHst1D *h,
                                                         gboolean z);
gboolean            gtk_hst1d_stats                     (GtkHst1D *h);
void                gtk_hst1d_set_curve_colors          (GtkHst1D *h,
                                                         ...);
void                gtk_hst1d_add_curve_color           (GtkHst1D *h,
                                                         gchar *color_name);
int                 gtk_hst1d_get_n_func                (GtkHst1D *h);
HstFunction*        gtk_hst1d_get_func                  (GtkHst1D *h,
                                                         int n);
void                gtk_hst1d_set_func                  (GtkHst1D *h,
                                                         HstFunction *f);
void                gtk_hst1d_sync_range                (GtkHst1D *h,
                                                         gboolean z);
void                gtk_hst1d_set_colors                (GtkHst1D *h,
                                                         ...);
  GObject
   +----GInitiallyUnowned
         +----GtkObject
               +----GtkWidget
                     +----GtkHst1D
                           +----GtkHst2D
  "filled"                   gboolean              : Read / Write
  "func"                     gpointer              : Read / Write
  "hxmax"                    gdouble               : Read / Write
  "hxmin"                    gdouble               : Read / Write
  "hymax"                    gdouble               : Read / Write
  "hymin"                    gdouble               : Read / Write
  "logx"                     gboolean              : Read / Write
  "logy"                     gboolean              : Read / Write
  "pixmap"                   GdkPixbuf             : Read
  "stats"                    gboolean              : Read / Write
  "vmax"                     gdouble               : Read / Write
  "vmin"                     gdouble               : Read / Write
  "xtitle"                   gchararray            : Read / Write
  "ytitle"                   gchararray            : Read / Write
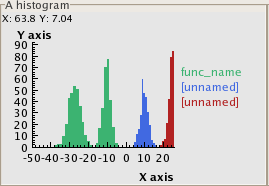
This widget visualizes any object deriving from HstFunction. It can display simultaneously varous HstFunction objects. One just have to add them to the list by calling gtk_hst1d_add_curve. They can also be retreived later by means of gtk_hst1d_get_func
In the case of 1D histograms one can magnify one of the axis, or both. You can choose a given range in any of the axis by selecting it with the left button of the mouse while pressing:
CTRL for the X axis or
SHIFT for the Y axis
The original range is restored pressing the mouse middle button.
Click the mouse right button to explore the popup menu and change some of the histogram attributes.
typedef enum {
    HST_COLOR_FOREGROUND,
    HST_COLOR_BACKGROUND,
    HST_COLOR_AXIS,
    HST_NCOLORS
}  GtkHstColors;
This emumeration is used to specified the colors for the canvas were the HstFunction object will be drawn.
typedef enum {
   HST_AXIS_NONE   = 0,
   HST_AXIS_LEFT   = 1,
   HST_AXIS_MIDDLE = 2,
   HST_AXIS_RIGHT  = 4,
   HST_AXIS_X_MASK = 0x0f,
   HST_AXIS_Y_MASK = 0xf0,
   HST_AXIS_Z_MASK = 0xf00
} GtkHstAxisPos;
typedef enum {
   HST_FILLED = 1,
   HST_LOGX   = 2,
   HST_LOGY   = 4,
   HST_STATS  = 8
} GtkHstAttr;
typedef struct {
    GtkWidgetClass parent_class;

    void (*draw_pixmap) (GtkHst1D *h);
    void (*draw_frame) (GtkHst1D *h);
    void (*draw_stats) (GtkHst1D *h);
    void (*draw_axis) (GtkHst1D *h);
    void (* mouse ) (GtkHst1D *h);
    void (*xtra_menu)(GtkHst1D *h, GtkWidget *w);
} GtkHst1DClass;
An object deriving from GtkHst1D has defined a number of methods which are call in the process of drawing the object.
GtkWidgetClass |
|
|
draws the curve or curves. |
|
computes the range of the axis |
|
draws the statistics in the case of plotting a histogram |
|
draws the axis |
|
|
|
if provided, it serves as a hook to add items in the popup menu. |
GtkWidget* gtk_hst1d_new (HstFunction *ff);
|
A HstFunction object to be drawn. This is the object that will define the range of the axis. Return value: a GtkWidget |
Returns : |
void                gtk_hst1d_add_curve                 (GtkHst1D *h,
                                                         HstFunction *f);
It adds a new function to the list. However, only the points in the range of the main function will be show.
|
A GtkHst1D object |
|
A HstFunction object that will added to the list of functions to be drawn. |
void gtk_hst1d_remove_curves (GtkHst1D *h);
Clears the list of functions to draw
|
A GtkHst1D object |
void                gtk_hst1d_monitor_start             (GtkHst1D *h,
                                                         int tim);
It sets up a timeout callback that will re-draw the
functions in the list every tim milliseconds.
|
A GtkHst1D object |
|
the time interval |
void gtk_hst1d_monitor_stop (GtkHst1D *h);
Stops the automatic re-drawing of the curves
|
A GtkHst1D object |
void                gtk_hst1d_draw_x_axis               (GtkHst1D *h,
                                                         GtkHstAxisPos val);
Specifies where to draw the X axis
|
A GtkHst1D object |
|
void                gtk_hst1d_draw_y_axis               (GtkHst1D *h,
                                                         GtkHstAxisPos val);
Specifies where to draw the Y axis
|
A GtkHst1D object |
|
gchar* gtk_hst1d_get_xtitle (GtkHst1D *hst);
|
A GtkHst1D object |
Returns : |
the title or label of the X axis |
void                gtk_hst1d_set_xtitle                (GtkHst1D *hst,
                                                         const char *tit);
Sets the label of the X axis
|
A GtkHst1D object |
|
the new tittle |
gchar* gtk_hst1d_get_ytitle (GtkHst1D *hst);
|
A GtkHst1D object |
Returns : |
the title or label of the Y axis |
void                gtk_hst1d_set_ytitle                (GtkHst1D *hst,
                                                         const char *tit);
Sets the label of the Y axis
|
A GtkHst1D object |
|
the new tittle |
void                gtk_hst1d_filled                    (GtkHst1D *h,
                                                         gboolean z);
If f is set, theh function will be drawn as a filled curve,
otherwise only a line will be drawn.
|
A GtkHst1D object |
|
boolean flag |
gboolean gtk_hst1d_is_filled (GtkHst1D *h);
|
A GtkHst1D object |
Returns : |
the value of the filled flag |
void                gtk_hst1d_logx                      (GtkHst1D *h,
                                                         gboolean z);
If f is set, theh function will be drawn with logarithmic
scale
|
A GtkHst1D object |
|
boolean flag |
gboolean gtk_hst1d_is_logx (GtkHst1D *h);
|
A GtkHst1D object |
Returns : |
if true, logarithmic scale is being used for the X axis |
void                gtk_hst1d_logy                      (GtkHst1D *h,
                                                         gboolean z);
If f is set, the Y axis will use logarithmic scale
|
A GtkHst1D object |
|
boolean flag |
gboolean gtk_hst1d_is_logy (GtkHst1D *h);
|
A GtkHst1D object |
Returns : |
if true, logarithmic scale is being used for the Y axis |
void                gtk_hst1d_show_stats                (GtkHst1D *h,
                                                         gboolean z);
If f is set we draw a summary if the statistics, like
numbe of entries, mean value, etc.
|
A GtkHst1D object |
|
boolean flag |
gboolean gtk_hst1d_stats (GtkHst1D *h);
|
A GtkHst1D object |
Returns : |
if true, we are drawing the stats. |
void                gtk_hst1d_set_curve_colors          (GtkHst1D *h,
                                                         ...);
|
A GtkHst1D object |
|
void                gtk_hst1d_add_curve_color           (GtkHst1D *h,
                                                         gchar *color_name);
Appends a color with this name to the list of colors for the variuos functions to draw. The color name should be recognized by gdk_color_parse
|
a GtkHst1D object |
|
an existing color name |
int gtk_hst1d_get_n_func (GtkHst1D *h);
|
A GtkHst1D object |
Returns : |
the number of functions to be drawn. |
HstFunction*        gtk_hst1d_get_func                  (GtkHst1D *h,
                                                         int n);
|
A GtkHst1D object |
|
the index of the function to be retrieved |
Returns : |
The HstFunction object that is stored at
position n in the list of function to be drawn.
|
void                gtk_hst1d_set_func                  (GtkHst1D *h,
                                                         HstFunction *f);
Sets f as the main function to draw. THis will be the function
defining the range of the axis.
|
A GtkHst1D object |
|
A HstFunction object |
void                gtk_hst1d_sync_range                (GtkHst1D *h,
                                                         gboolean z);
If z is true, the widget will recompute the range of the
axis and will redraw the curves whenever the the range of
the main HstFunction changes.
|
A GtkHst1D object |
|
a boolean flag |
void                gtk_hst1d_set_colors                (GtkHst1D *h,
                                                         ...);
Sets the colors for the axis, background an foreground of the canvas. The colors are given with names that gdk_parse_color understands preceded by the item that will receive the color.
|
a GtkHst1D object |
|
NULL terminated list of color names. |
"filled" property"filled" gboolean : Read / Write
If set draws a filled histogram.
Default value: FALSE
"func" property"func" gpointer : Read / Write
The pointer of the main function to be displayed in the widget. This is the function that will fix the range of the axis.
"hxmax" property"hxmax" gdouble : Read / Write
Maximum value of X in the histogram range.
Default value: 1
"hxmin" property"hxmin" gdouble : Read / Write
Minimum value of X in the histogram range.
Default value: 0
"hymax" property"hymax" gdouble : Read / Write
Maximum value of Y in the histogram range.
Default value: 1
"hymin" property"hymin" gdouble : Read / Write
Minimum value of Y in the histogram range.
Default value: 0
"logx" property"logx" gboolean : Read / Write
If set shows X axis in log scale.
Default value: FALSE
"logy" property"logy" gboolean : Read / Write
If set shows Y axis in log scale.
Default value: FALSE
"stats" property"stats" gboolean : Read / Write
If set shows the statistics.
Default value: FALSE